

Understanding Data Modeling in Power BI: Concepts and Best Practices 😊


Hey! Let’s talk about data modeling in Power BI. You’ve probably heard how important this is, but don't worry, I’m here to explain it in simple, everyday language. We'll cover everything from what it is to how to do it right, with easy examples. Ready? Let's dive in! 😊
What is Data Modeling in Power BI?
Data modeling in Power BI is like creating a plan for how your data should be organized. Think of it like organizing your kitchen. You wouldn’t just toss plates, pans, and utensils in random places, right? You need a system. Data modeling does the same for your data. It helps Power BI understand how to connect and use the information.
Why is Data Modeling Important?
Good data modeling makes Power BI reports faster and easier to use. Imagine your data as a cluttered room. Organizing it makes everything easier to find. Well-organized data leads to quick and clear insights, and you’ll spend less time waiting for reports to load.

Key Concepts in Power BI Data Modeling
Tables: These are containers for your data. Each table holds related information. For example, one table might store sales data, and another stores customer details.
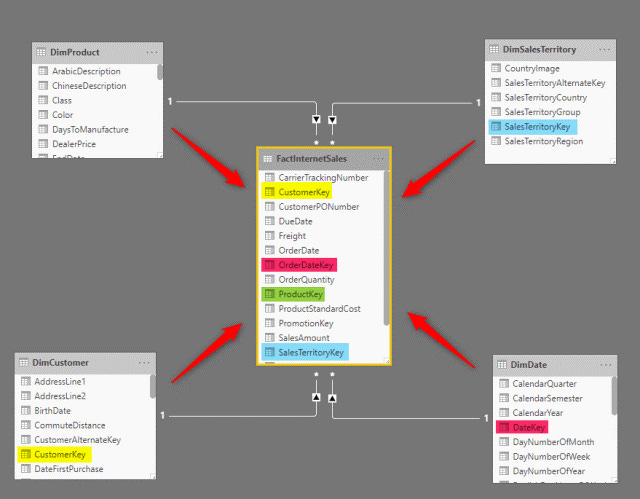
Relationships: This is how tables connect to each other. For example, you can link a sales table to a customer table using a unique customer ID. This lets Power BI know which customer made which purchase.
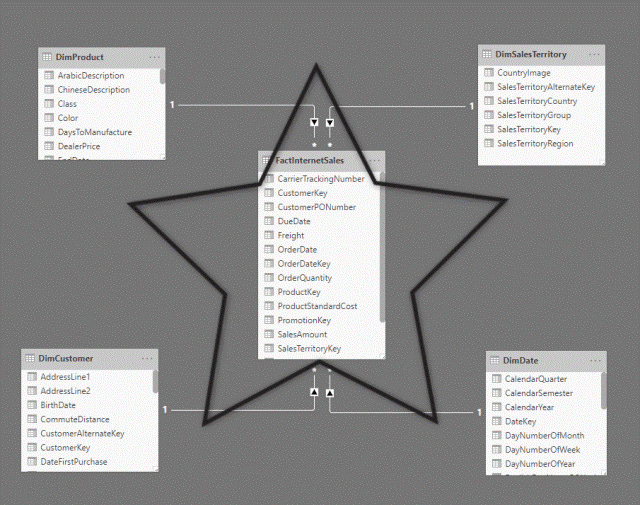
Star Schema: A popular method for organizing your data. Picture a star! The fact table (main data like sales totals) is in the center, and the dimension tables (like product names or dates) are the points of the star. This setup makes it easy to analyze.
Understand Your Data Before you start building your data model, take the time to understand the data you are working with. Identify the key metrics, dimensions, and relationships that are important for your analysis.
Best Practices for Power BI Data Modeling (Tips to Succeed)
Keep It Simple: Don’t clutter your model with unnecessary tables or columns. The cleaner it is, the faster it runs.
Use Numeric Keys: When you link tables, always use numbers (like IDs) instead of text. Power BI processes numbers much faster.
Normalize Your Data: Break up your data into smaller, logical pieces. For example, instead of storing sales and product details in one table, split them. This avoids repeating data and makes your model more efficient.
Create Calculated Columns and Measures: Use Power BI’s DAX (Data Analysis Expressions) to do quick math. For example, you can create a column that calculates total sales by multiplying the quantity by the price.
Example of Data Modeling in Power BI
Let’s say you’re analyzing sales. You have one table for sales transactions and another for products. You can link these using the product ID. Now you can see which products are selling the most. Simple, right?
Conclusion: Mastering Data Modeling in Power BI
Data modeling in Power BI is like organizing a room. Keep it tidy, use numeric keys, and break data into smaller chunks. Follow these steps, and your Power BI reports will not only be fast but easy to understand. Got any questions? Feel free to ask! 😊
By following these tips and best practices, you’ll make sure your Power BI reports are efficient and easy to maintain. Whether you’re new to data modeling or just want to improve, keeping your data organized is key to success.