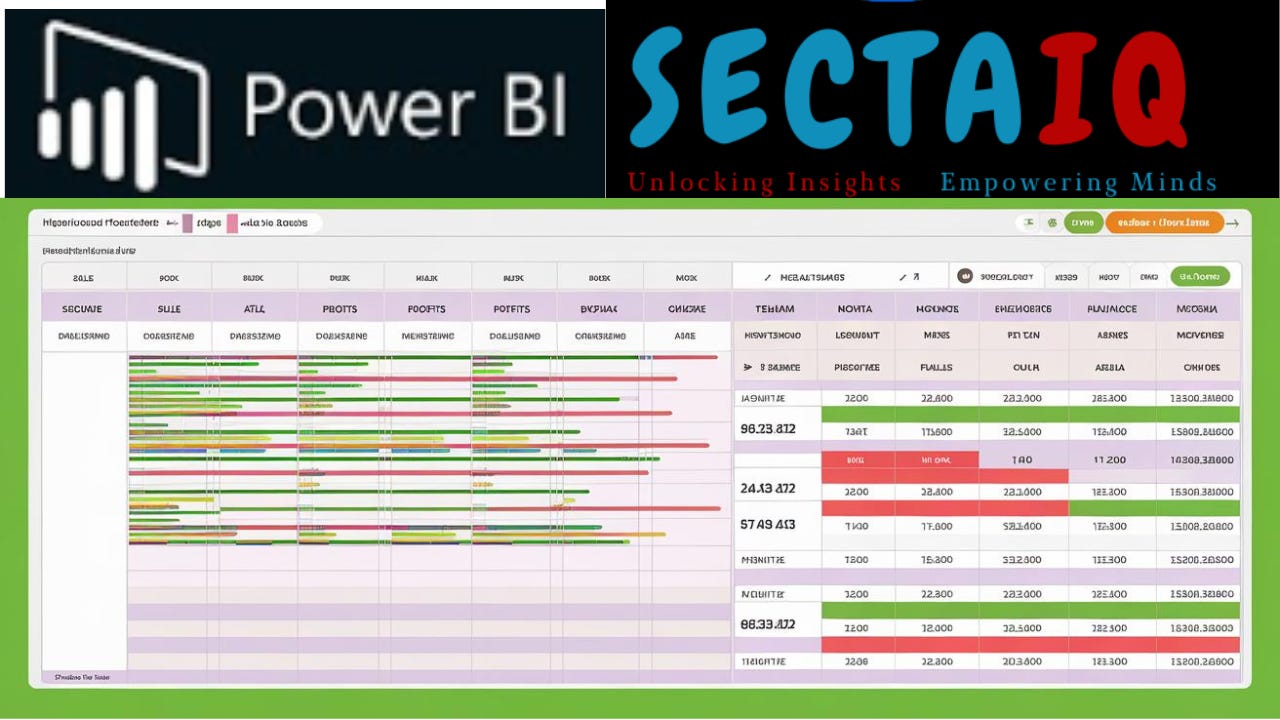
HOW TO CONDITIONAL FORMATTING in POWER BI
Learn How to Highlight Key Data and Use Data Bars Effectively
Hey there! Today, let’s dive into conditional formatting in Power BI. It’s a game-changer for making your data pop. 🌟
What is Conditional Formatting?
Conditional formatting changes how data looks based on conditions. Think of it as a way to highlight important info. For example, you can make high sales numbers green and low ones red. 🚦
Why Use Conditional Formatting?
It helps you spot trends and outliers quickly. Imagine a table with sales data. With conditional formatting, you can see top-performing products at a glance. 📈
How to Apply Conditional Formatting
Let’s get into the steps. It’s easier than you think!
Select Your Data: Open your Power BI report. Click on the table or matrix you want to format.
Open Conditional Formatting: In the Visualizations pane, click the down-arrow next to the field you want to format. Select “Conditional formatting.”
Choose Your Format: You can choose background color, font color, data bars, or icons. Let’s start with background color.
Set Your Rules: Decide the conditions. For example, set sales above $10,000 to green and below $5,000 to red.
Apply and Enjoy: Click OK. Watch your data transform! 🎨
Examples to Make It Clear
Example 1: Highlighting Sales Performance
You have a sales table.
Apply conditional formatting to the “Sales” column.
Set rules: Green for sales > $10,000, Red for sales < $5,000.
Now, high and low sales stand out instantly.
Example 2: Using Data Bars
Select a numeric column, like “Profit.”
Choose “Data bars” in conditional formatting.
Higher profits will have longer bars.
This visual cue makes it easy to compare profits.
Advanced Tips
Use Icons: Add icons to show trends. Up arrows for growth, down arrows for decline. 📊
Combine Formats: Use both background color and data bars. This adds layers to your analysis.
Dynamic Formatting: Use DAX formulas for more complex rules. For example, highlight sales that exceed last year’s by 20%.
Final Thoughts
Conditional formatting in Power BI is powerful. It makes your data visually appealing and easier to understand. Whether you’re a beginner or a pro, these tips will help you get the most out of your data. 🚀
So, what are you waiting for? Start using conditional formatting today and make your data shine! ✨
I hope this helps you get started with conditional formatting in Power BI. If you have any questions, feel free to ask. Happy analyzing! 😊
#PowerBI #DataVisualization #ConditionalFormatting #DataAnalysis #BusinessIntelligence #Analytics #DataScience


